Digital Strategy
Know Your State
Building the intelligence infrastructure that lets a state plan with precision, include everyone, and earn its own way.
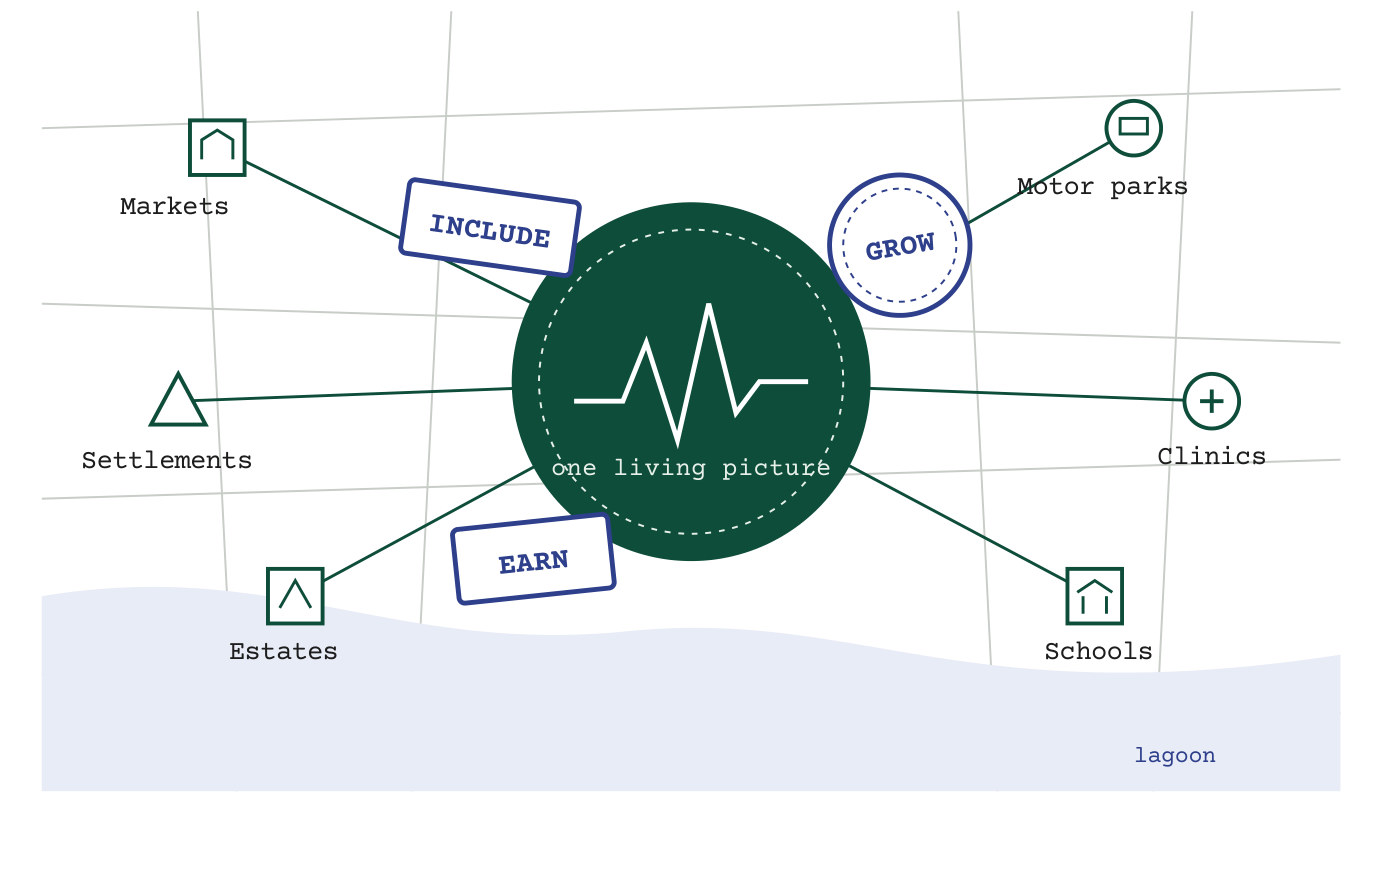
A state that cannot see its economy cannot grow it, tax it fairly, or put it in front of an investor. Most states still plan and tax from a partial, dated picture. Markets, motor parks and informal settlements move faster than the last survey, and the next plan starts from what the state once knew.
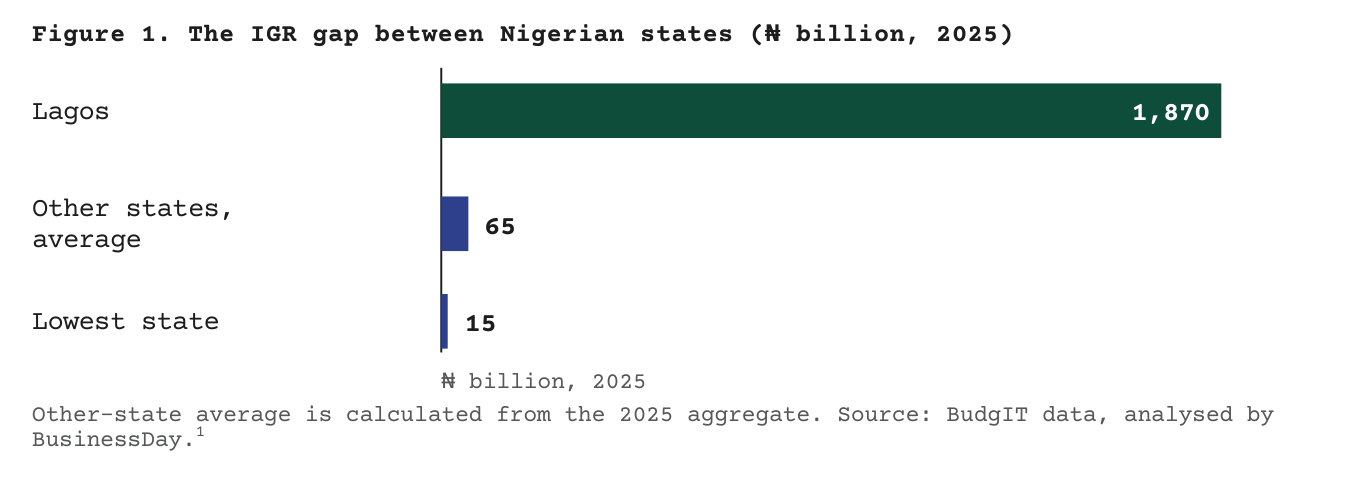
State IGR reached about NGN 4.15 trillion in 2025. Lagos raised about 45% of it. The lowest-earning states raised between NGN 15 billion and NGN 21 billion. Lagos tied an 18.5% rise in its own IGR that year to seeing more of the economy: geo-tagging, and tax records linked to company registration. The gap between states is not only size. It is visibility. What a state cannot see, it cannot tax, and a programme reaches the places already on the map.
A picture the state owns
The work is a permanent picture of the state, owned by the state, that a leader can question in plain words. Field teams record markets and business clusters, informal settlements, motor parks and corridors, residential estates, schools and clinics, and the ports, industry and coast the state depends on. Ministry records for tax, residents and land connect to that picture, with maps and satellite. Telecom and payments come in aggregated only. A citizen can report, and a report that checks out is rewarded.
Personal data stays with the state. What can be shared onward is aggregated insight.
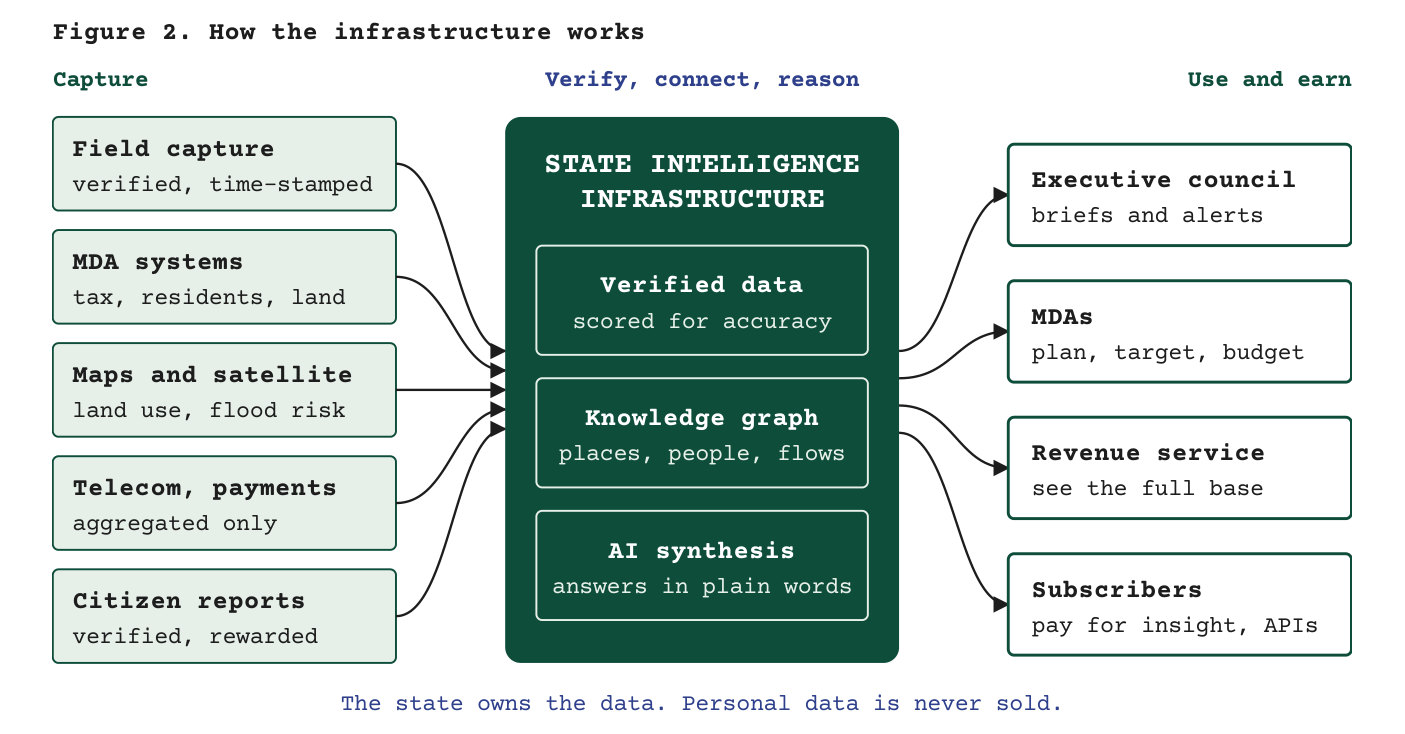
A dashboard says what already happened. This picture should say why, and what to do next. How many children are out of school, and where. Why one market earns more than another. Where a new clinic reaches people who have none. Whether a drainage project actually cut the flooding. The question can be asked in English, Yoruba, Hausa, Igbo or Pidgin, on the web, a phone, WhatsApp or USSD. Every answer shows its sources, and how sure it is.
The same measure can be split by gender, age, disability, income and place. The test of the work is whether the poorest fifth of communities improves faster than the richest.
Why this year
The 2025 tax reforms, and the pressure on federal allocations, push a state toward revenue it raises itself. A base that has not been measured is a base that cannot grow. Reading a survey against an audit against a register used to take a team months. It can now be asked in a sentence. Investors already compare states on evidence. And in a city that is still being built, the last census is the wrong map.
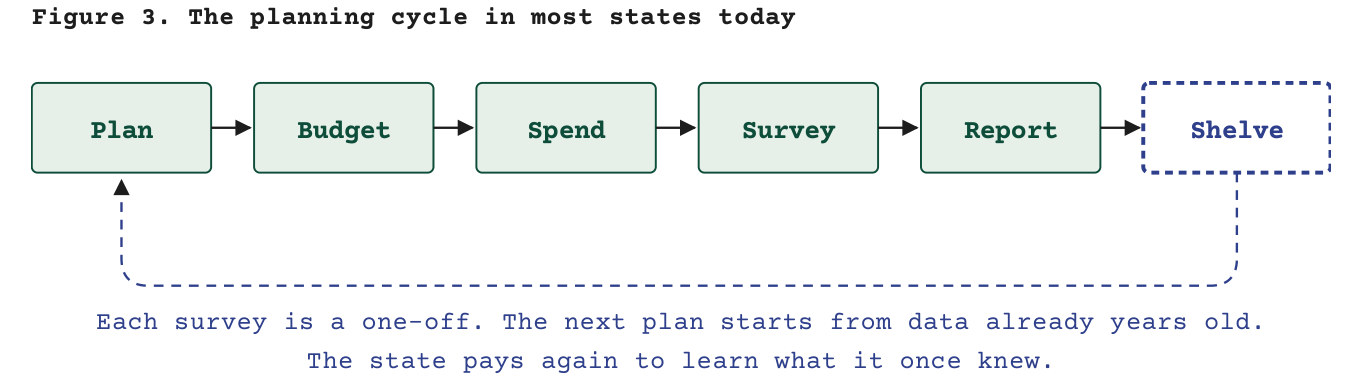
The cycle most states still run is plan, budget, spend, survey, report, shelve. Each survey is a one-off. The state pays again to learn what it once knew.
What already proves it
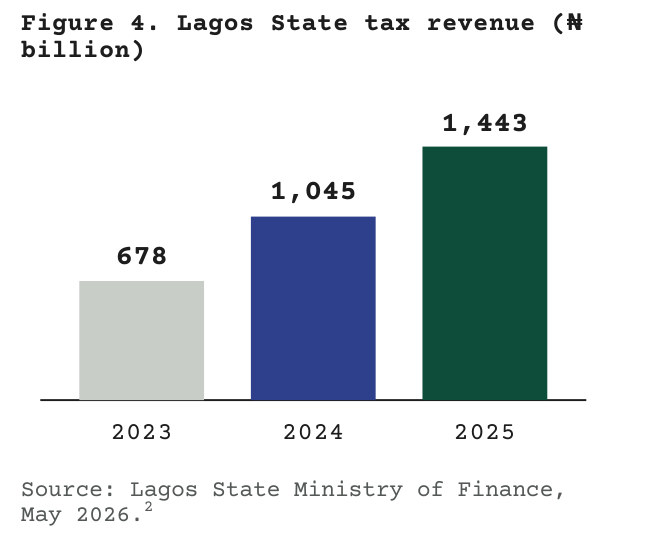
The pieces exist elsewhere, and the counting has already been done here. Andhra Pradesh runs 55 databases across 41 departments from the centre of government. Lagos credits digital reforms for tax revenue that rose from NGN 678 billion in 2023 to NGN 1.44 trillion in 2025. Ordnance Survey, owned by the British government, serves more than 5,000 organisations from one authoritative map. The value of reused public data in Europe is projected to grow from EUR 52 billion in 2018 to EUR 194 billion by 2030.
Know Lagos gathered data in markets, informal settlements and motor parks, the hardest places in a megacity to count. Each record is time-stamped, checked against its location, and scored for accuracy. It is accepted or rejected as it comes in. A state does not take this statewide until that accuracy passes 90%.
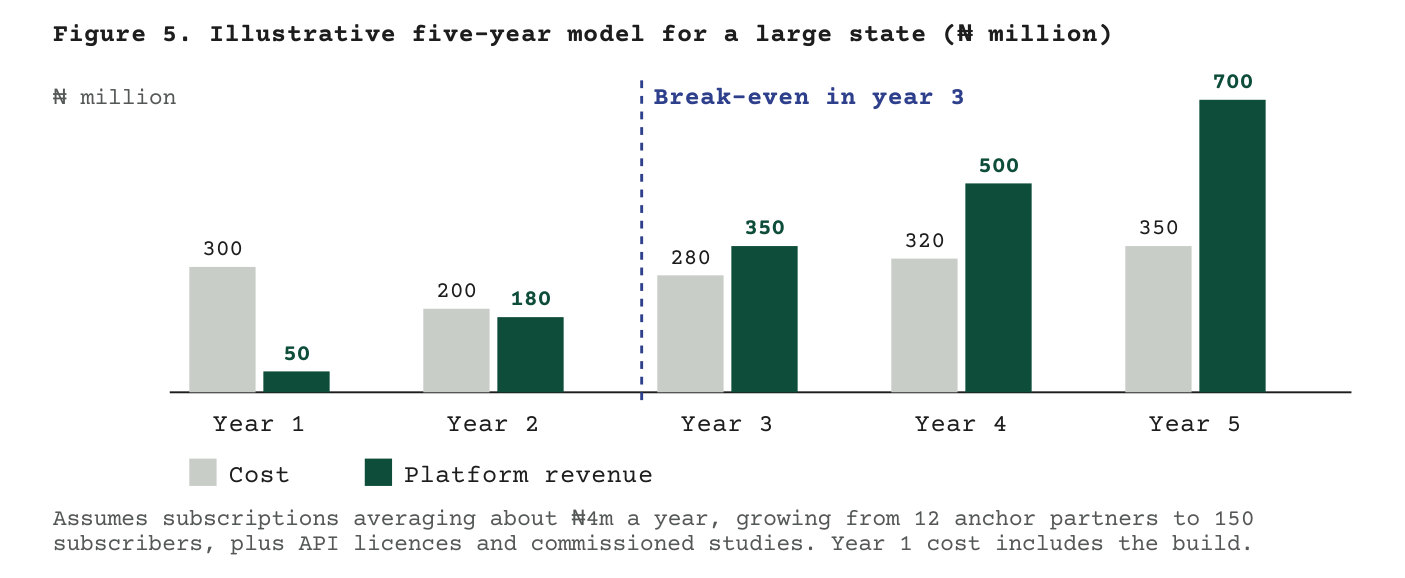
An illustrative model for a large state, paid for by subscriptions, API licences and commissioned studies, breaks even in year 3 and returns revenue from year 4. The state owns the platform and the data, keeps a share of what the platform earns, and sells only aggregated insight. Once markets and parks are mapped, the revenue service can also see a base it does not have today. That gain goes straight to IGR, and it sits outside the model.
What a leader can show
A governor has one term to show what changed. Finance is asked for revenue without a new tax. Planning is asked to use facts that are still current. The revenue service is asked to widen the base without guessing who is in it. A statistics bureau is asked for numbers people will trust. A foundation or an anchor company is asked where the money went, and what it changed. One picture serves all of them.
A project ends with the administration that commissioned it. A state's knowledge of itself keeps paying the next one.
The work fails in familiar ways. A new government drops it. The data is thin, and trust goes with it. Communities refuse to be counted. A confident answer points a decision the wrong way. It holds when it is anchored in law, the method is published, the places being counted help design it, each answer shows how sure it is, and personal data stays under the NDPA.
Where to start
Pick one decision the governor has to make this quarter, and answer it with evidence nobody had. That single answer does more than a launch.
Three questions for the executive council this week. What can we not answer about our state today? Which markets, settlements and parks are missing from the records? Which companies would pay for a better picture? If the answers are uncomfortable, that is where the work begins.
Omoseindemi Olobayo, +234 904 999 9993, seinde@softcom.xyz.